
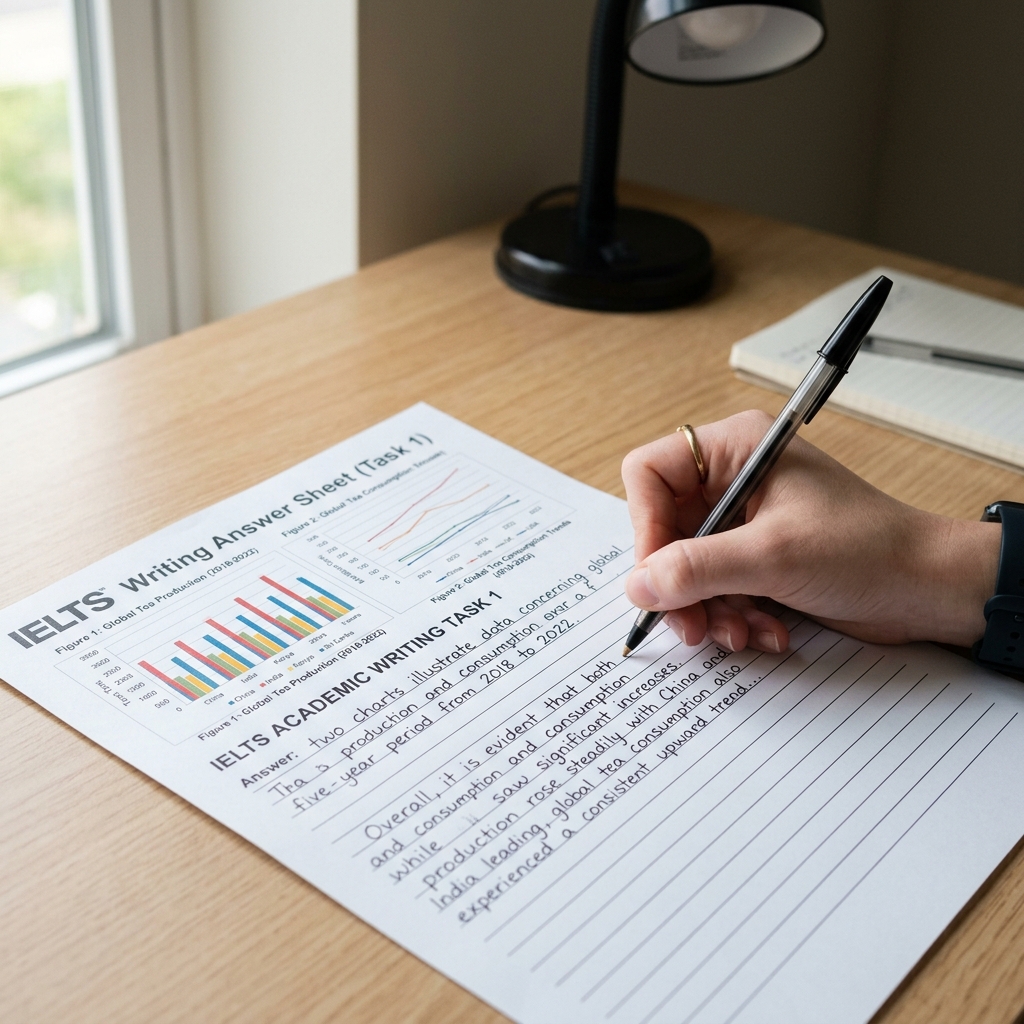
The IELTS Writing Task 1 Academic module tests your ability to analyze visual data and translate it into a formal, structured report. You are required to write a report of at least 150 words in 20 minutes, describing the main features of a line graph, bar chart, pie chart, table, process diagram, or map.
Many candidates struggle with this section because they make the mistake of listing every single data point, resulting in a disorganized list of numbers rather than a cohesive summary. To achieve a Band 7 or higher, you must demonstrate structural clarity, write a clear "Overview" paragraph, and use a wide range of vocabulary to describe trends and comparisons.
If you are updating your international academic or visa documents, you can use our CV Builder to format a professional resume. To practice explaining data and presenting your ideas fluently under time pressure, rehearse with our AI Interview Coach.
The 3-Step Report Structure
To secure high marks in Coherence and Cohesion, divide your report into four paragraphs using this logical three-step structure:
Paragraph 1: The Introduction (20–30 Words)
Paraphrase the prompt in one or two sentences. Change the subject, verbs, and nouns using synonyms, and specify the time frame.
- Prompt: The line graph below shows the number of visitors to three different museums between 2015 and 2020.
- Paraphrased Introduction: The line graph compares the volume of people who visited three distinct galleries over a five-year period starting in 2015.
Paragraph 2: The Overview (40–50 Words)
[!IMPORTANT] The Overview is the most critical paragraph of your entire report. It must summarize the most significant trends or features without listing specific numbers. If you omit the overview, you cannot achieve higher than a Band 5.0 for Task Achievement.
Start this paragraph with the word Overall. Focus on:
- Which categories experienced the highest growth or decline.
- The highest and lowest peaks.
- General upward or downward trends.
Paragraphs 3 & 4: The Detail Paragraphs (80–100 Words)
Provide the mathematical data and specific numbers to support your overview. Group similar data together. For example, discuss the upward trends in Paragraph 3 and the downward or stable trends in Paragraph 4. Compare data points rather than listing them in isolation.
Trend Vocabulary: Verb-Adverb vs. Adjective-Noun
To score high in Grammatical Range and Lexical Resource, you must alternate between two different grammatical structures when describing changes:
1. The Verb-Adverb Structure
- Formula: Subject + Verb + Adverb
- Example: The number of visitors increased sharply in 2018.
2. The Adjective-Noun Structure
- Formula: There + was/were + Adjective + Noun + in + Subject
- Example: There was a sharp increase in the number of visitors in 2018.
Key Trend Terms to Memorize
Use a variety of vocabulary to describe the speed and size of the changes:
| Type of Change | Verbs | Nouns | Adjectives / Adverbs |
|---|---|---|---|
| Upward | rise, increase, climb, surge, peak | growth, rise, upward trend, surge | sharp / sharply, dramatic / dramatically |
| Downward | fall, decrease, decline, drop, plunge | reduction, decline, fall, drop | steady / steadily, gradual / gradually |
| Stable | stabilize, remain steady, remain constant | stability, plateau | constant, unchanged |
| Fluctuation | fluctuate, undulate | fluctuation, variation | wild / wildly, erratic / erratically |
3 Golden Rules for Academic Task 1
1. Never express personal opinions or explanations
Do not try to explain why the data changed. If a graph shows sales dropping in December, do not write: "Sales dropped because of Christmas shopping holidays." Your task is strictly to describe what the data shows, not why it happened.
2. Group data points logically
If you are presented with a table containing 30 numbers, do not list them all. Group the data by categorizing them into highs, lows, and mid-ranges. Highlight the key comparisons (e.g. "Category A was double Category B in 2016").
3. Check your tenses
Look at the dates on the chart. If the dates are in the past (e.g. 2010 to 2015), you must write the entire report in the past tense. If the chart projects future trends (e.g. up to 2040), use future tenses (e.g. is projected to, is expected to, will likely).
Frequently Asked Questions
What happens if I write fewer than 150 words?
If your report is under 150 words, you will receive a penalty score for Task Achievement, which will drag down your overall writing band. Aim to write between 160 and 180 words to ensure you meet the requirement without wasting time.
How are tables described differently than charts?
The structure remains the same. The only difference is that tables do not visually display trends. You must analyze the columns and rows to find the maximum values, minimum values, and general trends yourself before you begin writing.
Should I write a conclusion?
No. An academic report describing data does not require a conclusion. The "Overview" paragraph serves as the summary of the main features. Writing a conclusion often leads to repetition of information, which wastes valuable time.
IELTS Writing Task 1 Checklist
Verify your report structure before practicing:
- Overview Paragraph Included: The second paragraph starts with "Overall" and summarizes the main trends without numbers.
- No Personal Opinions: The report is purely factual and contains no explanations for the data.
- Sentence Variety Checked: You have alternated between Verb-Adverb and Adjective-Noun structures.
- No Double Quotes inside Blockquotes: Ensure blockquote examples do not contain manual double quotes.
- Three Short Tags: The post's frontmatter contains exactly three short tags.
- Relative Internal Links: Verify links point correctly to the builder, optimizer, and interview coach.
Practice with our AI Mock Interviewer
Simulate real interviews, get instant feedback, and build confidence before the big day.
Start PracticingWritten by
Mehmet Kerem Mutlu
Founder of AlignCV · Mechanical Engineering Student
Mehmet Kerem is a mechanical engineering student and the founder of AlignCV — an AI-powered career platform built to help every job seeker land their next role with confidence. Combining his engineering mindset with a passion for product development, he designs tools that make CV writing, cover letter generation, and interview preparation faster and smarter. He writes about career strategy, AI in hiring, and the future of work.